How to Read Crypto Charts for Beginners in 2026
Affiliate Disclosure: This article may contain affiliate links. We may earn a commission at no extra cost to you. All opinions are our own.
Marcus Chen
Senior Crypto Analyst & Educator
Certified Blockchain Professional | Former Wall Street Analyst
Marcus Chen is a cryptocurrency analyst and educator with over 8 years of experience in digital asset trading. He has helped thousands of beginners navigate the crypto markets through practical, actionable education.
Affiliate Disclosure: This article contains affiliate links. We may earn a commission at no extra cost to you if you make a purchase through these links. See our affiliate disclosure for details.
How to Read Crypto Charts for Beginners in 2026
If you've ever stared at a crypto chart and felt like you were reading a foreign language, you're not alone. Knowing how to read crypto charts is one of the most valuable skills any new investor can develop — and it's far less complicated than it looks at first glance. Whether you're watching Bitcoin bounce between $90K and $105K or trying to figure out if Ethereum is about to break out, charts give you a structured way to cut through the noise and make decisions based on data, not gut feelings. This guide covers candlestick basics, support and resistance, volume, RSI, moving averages, and a simple daily routine you can start using today.
Why Reading Crypto Charts Matters
Crypto markets run 24 hours a day, seven days a week. There's no closing bell, no circuit breaker, and no market maker smoothing out the volatility. Without some framework for reading price action, you're essentially flying blind — buying when everyone else is euphoric and panic-selling when the market dips 15%.
Charts don't predict the future. What they do is show you the history of supply and demand at every price level, giving you a probabilistic edge. In 2026, with institutional players, algorithmic bots, and on-chain data all influencing price, technical analysis has become even more relevant as a filter for timing entries and exits. Even long-term holders benefit — knowing how to read a chart helps you avoid buying at obvious resistance zones or selling into panic at key support levels.
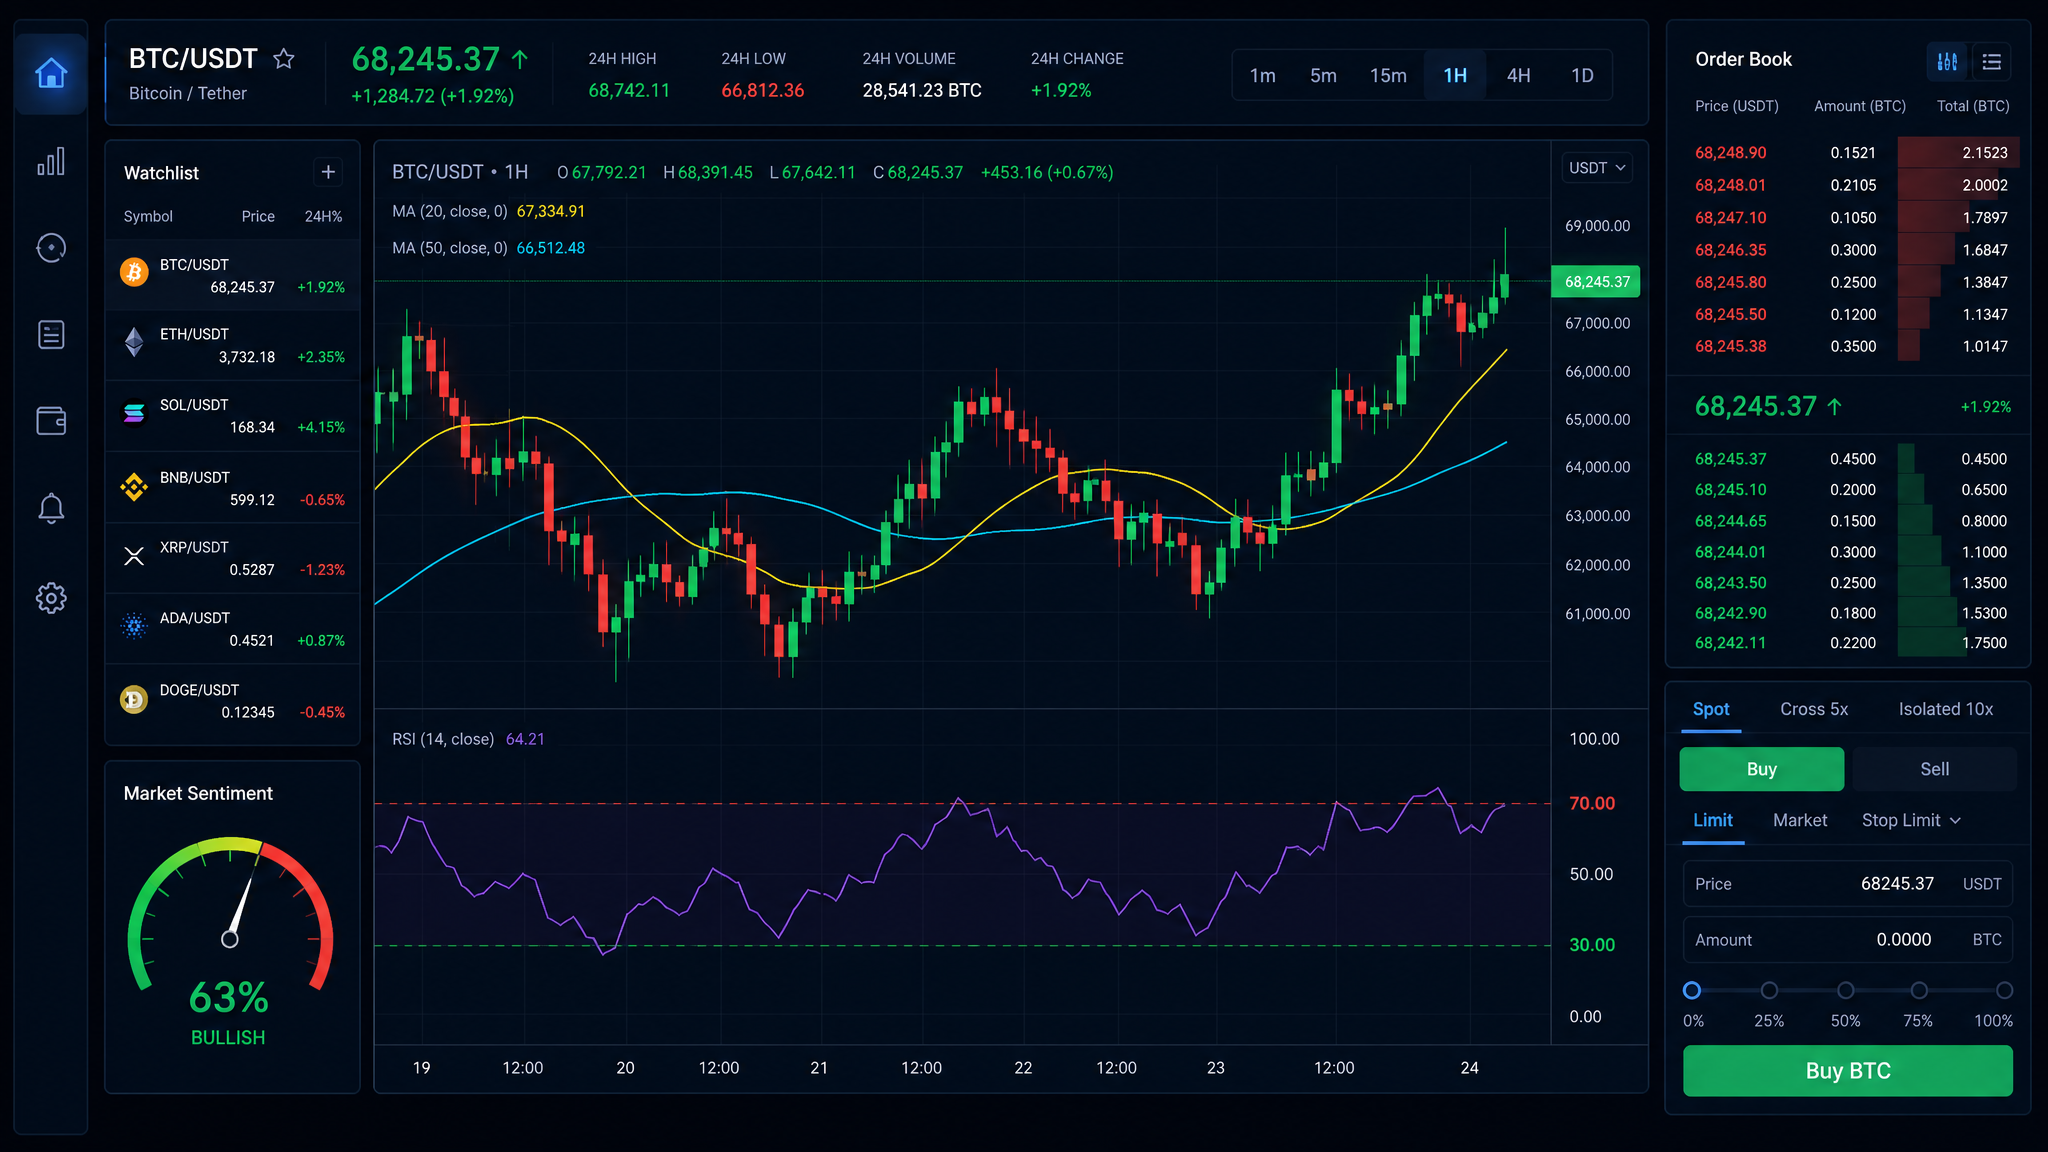
Understanding Candlestick Charts
The candlestick chart is the standard format used on virtually every crypto exchange and charting platform. Each "candle" represents a specific time period — it could be 1 minute, 1 hour, 1 day, or 1 week — and packs four pieces of information into a single visual element.
What Each Candle Tells You
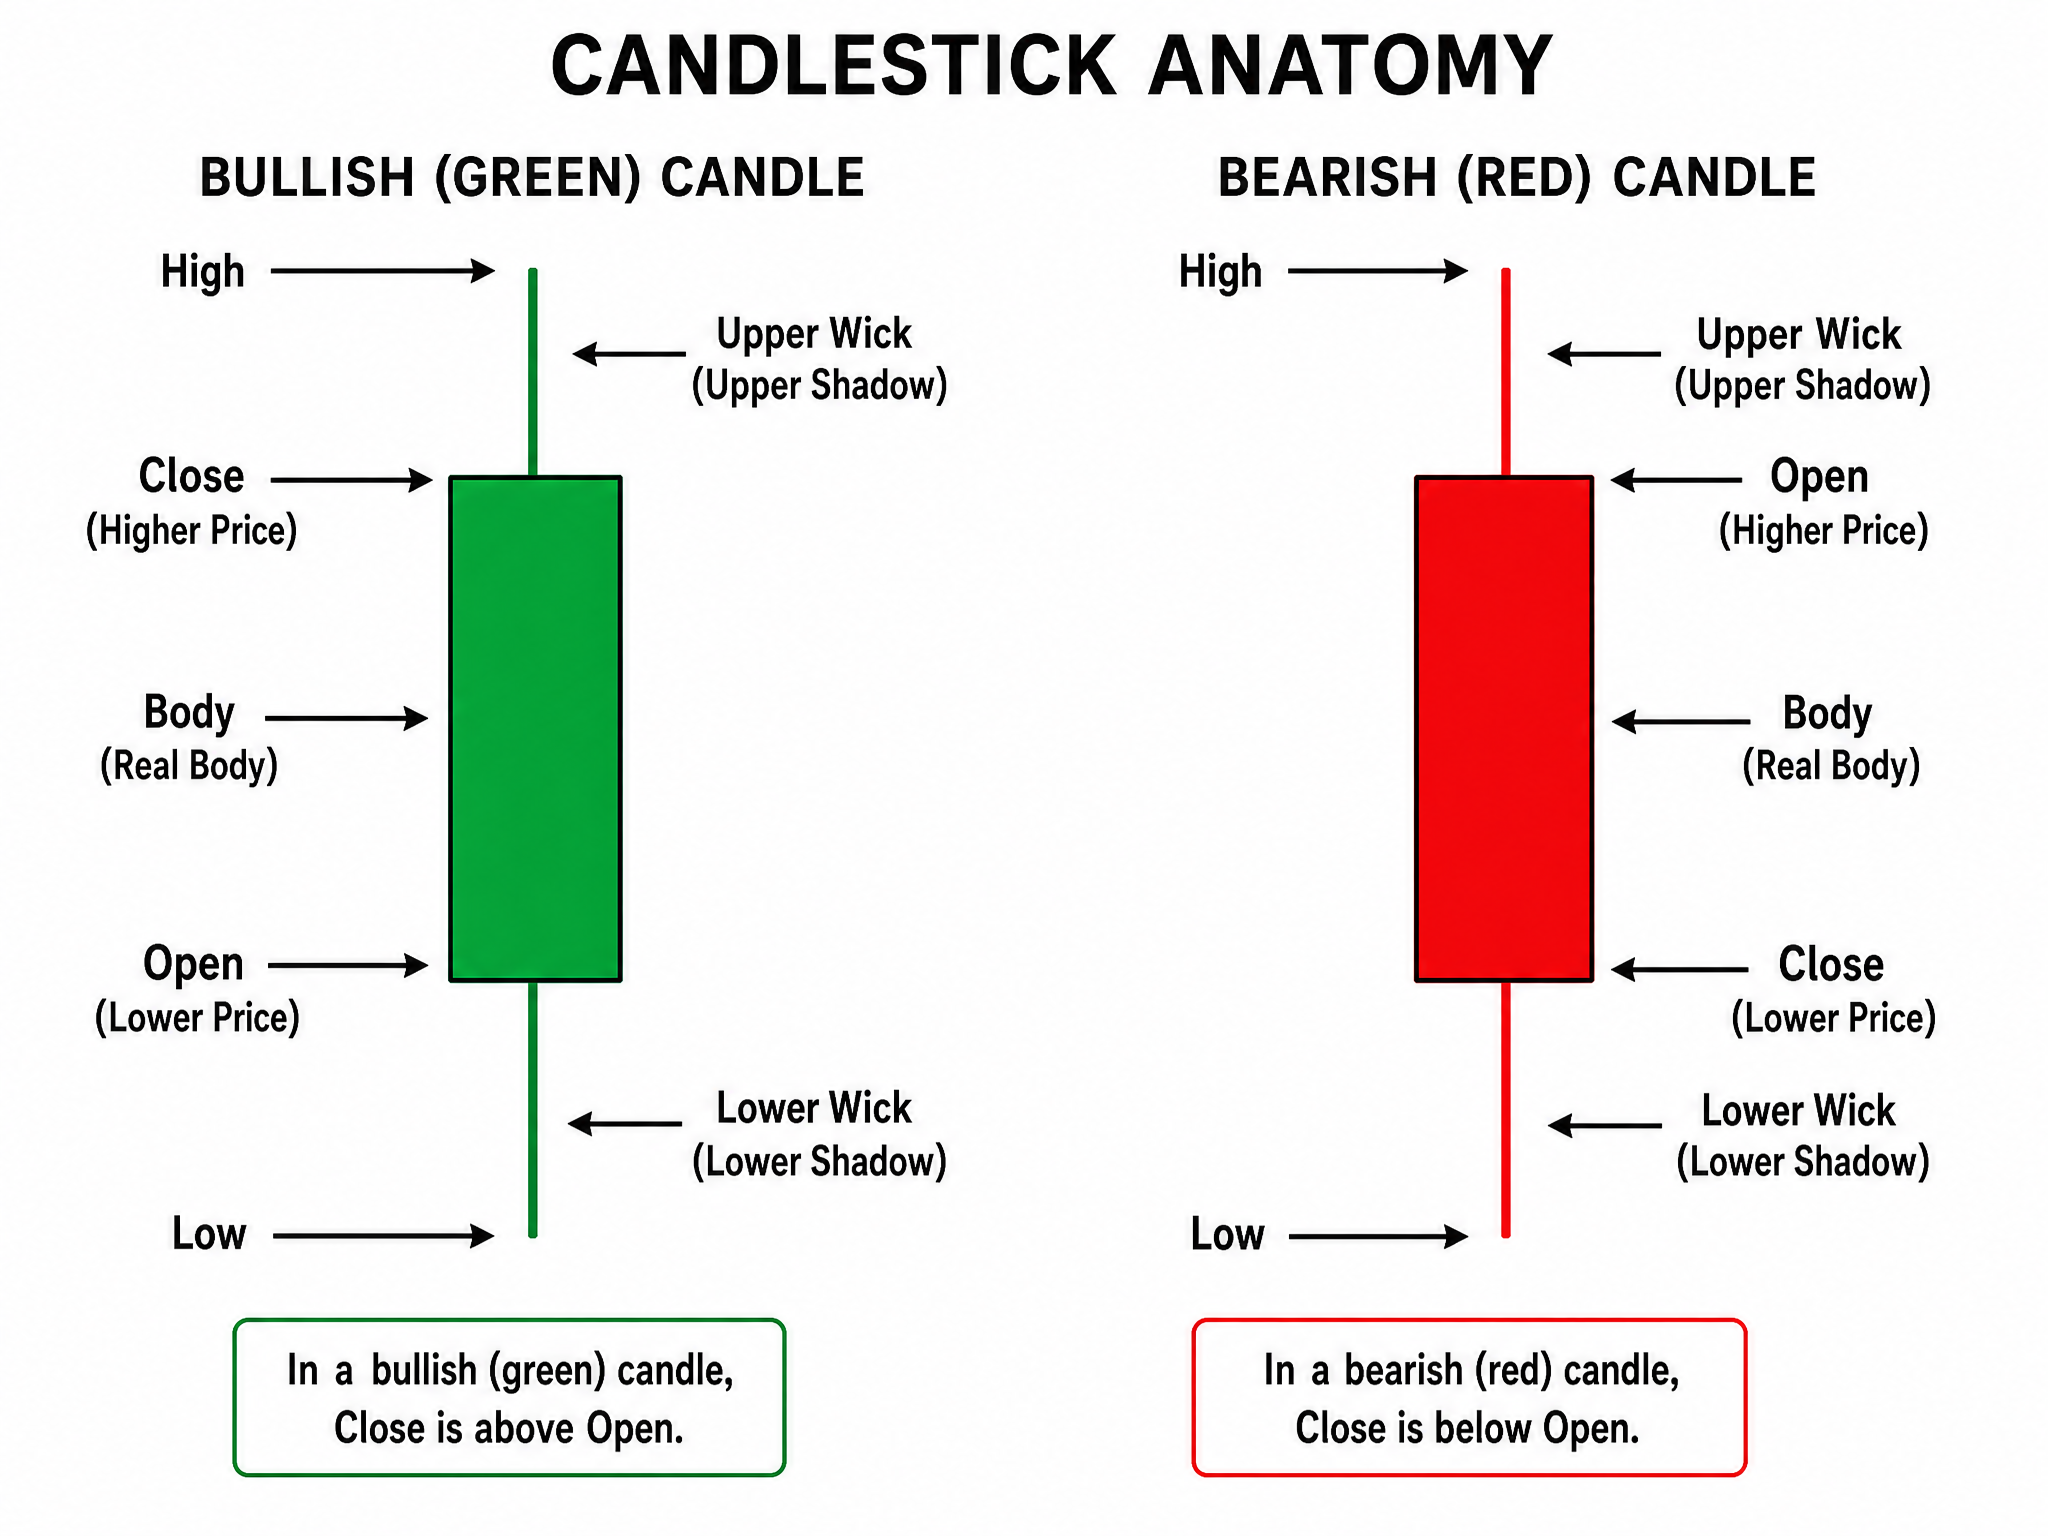
Every candlestick has four data points:
- Open: The price at the start of the time period
- Close: The price at the end of the time period
- High: The highest price reached during the period
- Low: The lowest price reached during the period
The thick part of the candle — called the body — shows the range between open and close. A green (bullish) candle means the price closed higher than it opened. A red (bearish) candle means it closed lower. The thin lines extending above and below the body are called wicks (or shadows), and they show the high and low extremes for that period.
Wicks matter: a long upper wick on a green candle signals rejection at higher prices (potentially bearish). A long lower wick on a red candle shows buyers stepped in and recovered losses — often a bullish signal.
Key Candlestick Patterns to Know
You don't need to memorize 50 candlestick patterns. Three will cover 80% of what you'll encounter:
- Doji: Open and close are nearly identical, creating a cross shape. This signals indecision — neither buyers nor sellers are in control. Often appears before a reversal or consolidation.
- Hammer: Small body at the top, long lower wick. Appears after a downtrend and suggests buyers are starting to push back. One of the most reliable bullish reversal signals.
- Engulfing Pattern: A large candle that completely "engulfs" the previous candle's body. A bullish engulfing (green candle swallowing a red one) signals strong buying momentum. A bearish engulfing does the opposite.
Context is everything. A hammer at a major support level carries far more weight than one in the middle of a range. Always look at the bigger picture before acting on a single candle.
Support, Resistance, and Volume
Support and resistance are price levels where buying or selling pressure has historically been strong enough to reverse or stall a move.
Finding Support and Resistance Levels
Support is a price floor — a level where buyers have repeatedly stepped in to prevent further decline. Resistance is the opposite: a ceiling where sellers consistently show up to cap upward moves. To find these levels, look for price areas where the chart has reversed multiple times. If Bitcoin bounced off $88,000 three times over two months, that's a strong support zone.
One important concept: when a resistance level is broken convincingly, it often flips to become support — called a role reversal. If BTC breaks above $105K with strong volume, that level becomes the new floor to watch on any pullback.
Why Volume Confirms Price Moves
Volume is the number of coins traded during a given period — and it's the most underrated tool for beginners. The rule: price moves with high volume are more significant than price moves with low volume. A breakout above resistance on 3x average volume signals genuine conviction. The same breakout on thin volume is often a "fakeout" that quickly reverses. Look for volume spikes of 25–30% above the 20-day average to confirm meaningful moves.
Essential Indicators for Beginners
There are hundreds of technical indicators, but beginners only need two to start: RSI and moving averages. Master these before adding anything else.
RSI (Relative Strength Index)
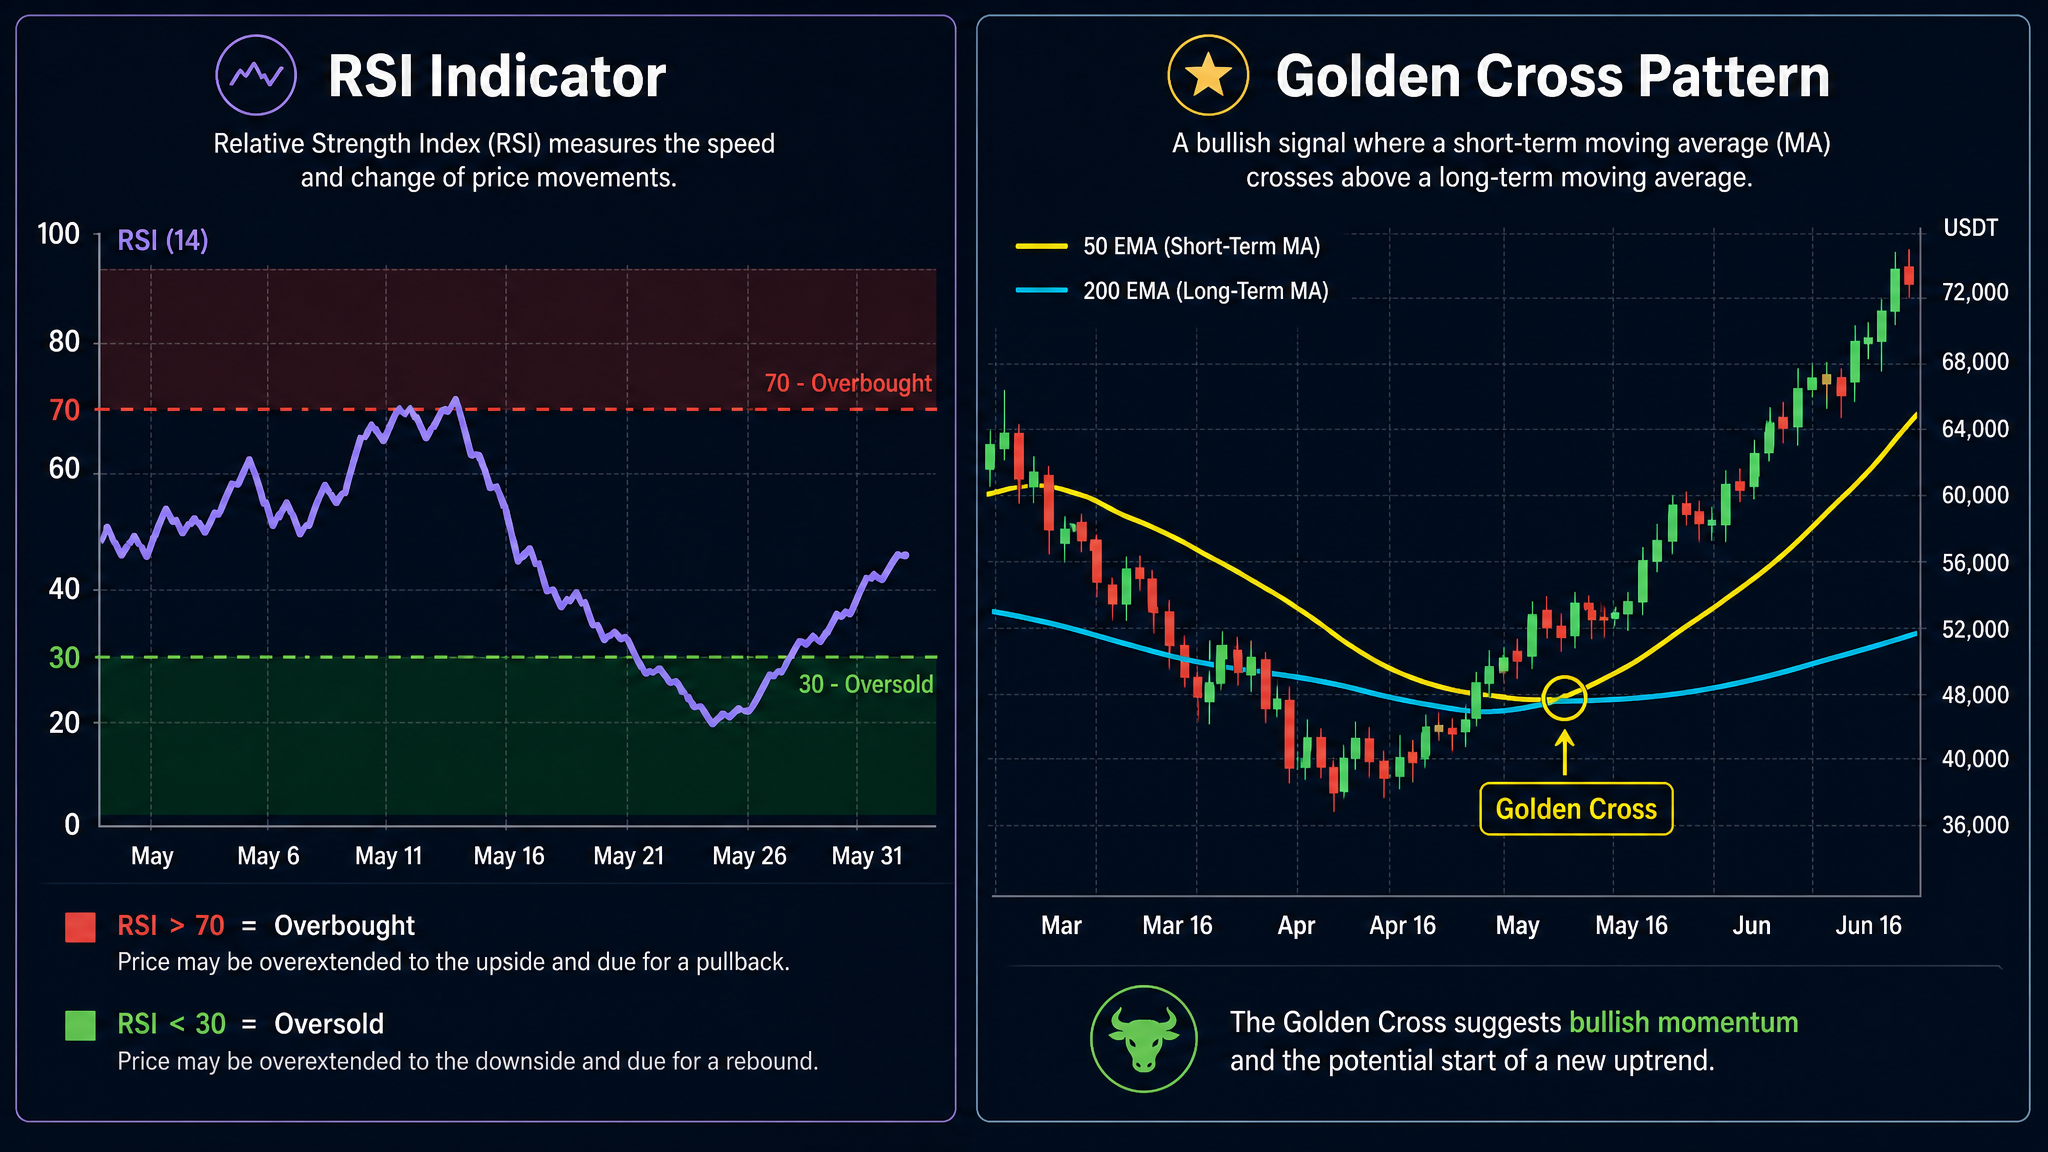
The RSI measures momentum on a scale of 0 to 100. RSI above 70 signals overbought conditions (potential pullback); below 30 signals oversold (potential bounce); around 50 is neutral. In strong trends, RSI can stay in extreme territory for extended periods. Its most powerful use is as a divergence signal — when price makes a new high but RSI makes a lower high, momentum is weakening even as price climbs, often preceding a reversal.
Moving Averages Explained
A moving average smooths out price data over a set number of periods. The two most common are the 50-day MA and the 200-day MA. A Golden Cross (50-day crossing above 200-day) is historically bullish — this signal preceded major Bitcoin rallies in 2020 and 2023. A Death Cross (50-day crossing below 200-day) is bearish. Moving averages also act as dynamic support and resistance — during uptrends, price often pulls back to the 50-day MA before bouncing, creating buying opportunities for patient traders.
Multi-Timeframe Analysis: The Top-Down Approach
One of the most common beginner mistakes is staring at a 5-minute chart and making decisions based on what looks like a major move — only to zoom out and realize it's a tiny blip on the daily chart. The fix is simple: always start with the higher timeframe to establish context, then zoom in to find your entry.
- Daily (1D) chart: Identify the major trend and key support/resistance levels. Is the structure bullish (higher highs, higher lows) or bearish?
- 4-Hour (4H) chart: Look for intermediate patterns and refine your key levels.
- 1-Hour (1H) chart: Time your entry with a candlestick confirmation signal at a level identified on the higher timeframes.
Trading against the daily trend on a 5-minute chart is one of the fastest ways to lose money in crypto. Want to accelerate your learning? Explore Icoinpro's daily trading signals and education platform — designed specifically to help beginners build chart-reading skills with real-time guidance.
Common Beginner Mistakes to Avoid
- Fighting the trend: Trying to short a strong uptrend or buy into a clear downtrend. The trend is your friend — don't argue with it.
- Ignoring volume: A breakout on low volume is a red flag, not a green light.
- Over-complicating the chart: Adding 8 indicators that all say different things. Two or three well-understood tools beat a cluttered chart every time.
- Emotional trading: Buying because a chart "looks bullish" after a 20% run, or selling because it "looks scary" after a 10% dip. Stick to your pre-defined levels.
- Ignoring risk management: Never risk more than 1–2% of your total capital on a single trade. A 2:1 reward-to-risk ratio is the minimum threshold.
Protect your crypto assets with a Ledger hardware wallet — the gold standard in cold storage security. Once you start accumulating meaningful positions, keeping them off exchanges is non-negotiable.
Putting It All Together: A Simple Chart Reading Routine
Here's a practical daily routine you can follow as a beginner:
- Check the daily chart first. What's the overall trend? Where are the major support and resistance levels? Is RSI in extreme territory?
- Note the 50-day and 200-day MAs. Is price above or below them? Are they trending up or down?
- Drop to the 4H chart. Look for any developing patterns or setups near your key levels.
- Check volume. Is recent volume above or below average? Are there any notable spikes?
- Set alerts. Most platforms let you set price alerts. Use them instead of watching charts all day — it reduces emotional decision-making significantly.
This whole process takes 10–15 minutes once you're comfortable with it. The goal isn't to predict every move — it's to have a clear plan before price reaches your levels, so you're reacting to a pre-defined scenario rather than making impulsive decisions in real time.
Want to understand the economics behind Bitcoin? The Bitcoin Standard is essential reading for every crypto enthusiast — it provides the fundamental context that makes chart analysis even more meaningful.
Key Takeaways
- Candlestick charts show open, close, high, and low for each time period — green candles are bullish, red are bearish
- Support and resistance are price zones where buying or selling pressure has historically been strong
- Volume confirms price moves — high-volume breakouts are more reliable than low-volume ones
- RSI measures momentum (above 70 = overbought, below 30 = oversold); moving averages identify trend direction
- Always use a top-down approach: daily chart for context, 4H/1H for entry timing
- Keep your chart simple, manage risk on every trade, and never fight the dominant trend
Frequently Asked Questions
What is the best chart type for crypto beginners?
Candlestick charts are the industry standard. They pack more information into each data point than line charts, making it easier to spot patterns and momentum shifts. Most exchanges and platforms like TradingView default to candlestick charts.
How long does it take to learn to read crypto charts?
Most beginners grasp the fundamentals — candlesticks, support/resistance, and basic indicators — within 2–4 weeks of consistent practice. Trading confidently typically takes 3–6 months of active chart study and paper trading (practicing without real money).
Is technical analysis reliable for crypto?
Technical analysis is a probabilistic tool, not a crystal ball. It works because many traders use the same levels and indicators, creating self-fulfilling patterns. It's most reliable on higher timeframes (daily and above) and for major assets like Bitcoin and Ethereum with deep liquidity.
Should I use technical analysis or fundamental analysis for crypto?
Both have value. Fundamental analysis helps you identify what to buy (projects with real utility and growing adoption). Technical analysis helps you determine when to buy (at favorable price levels with good risk/reward). Using fundamentals to select assets and technicals to time entries is a solid framework for most investors.
Want structured training instead of piecing it together yourself?
Self-education works, but it's slow. The course that accelerated my learning the most gave me a daily framework — real market analysis, real setups, real accountability.
The program I recommend to people who ask me is this crypto trading course — it\'s the one I point friends and family to when they\'re serious about learning. Daily lessons, live analysis, and a community that actually helps.
Affiliate link — I may earn a commission at no extra cost to you. I only recommend what I genuinely use.
Disclaimer: The information provided on this website is for educational and informational purposes only. It should not be considered financial or investment advice. Cryptocurrency investments carry significant risk. Always do your own research and consult with a qualified financial advisor before making investment decisions.
Free Crypto Insights
Get weekly trading tips, market analysis, and exclusive strategies delivered to your inbox.