Bitcoin ETF Outflows June 2026: The $4.4 Billion Institutional Exodus Explained
Affiliate Disclosure: This article may contain affiliate links. We may earn a commission at no extra cost to you. All opinions are our own.
Marcus Chen
Senior Crypto Analyst & Educator
Certified Blockchain Professional | Former Wall Street Analyst
Marcus Chen is a cryptocurrency analyst and educator with over 8 years of experience in digital asset trading. He has helped thousands of beginners navigate the crypto markets through practical, actionable education.
Bitcoin ETF Outflows June 2026: The $4.4 Billion Institutional Exodus Explained
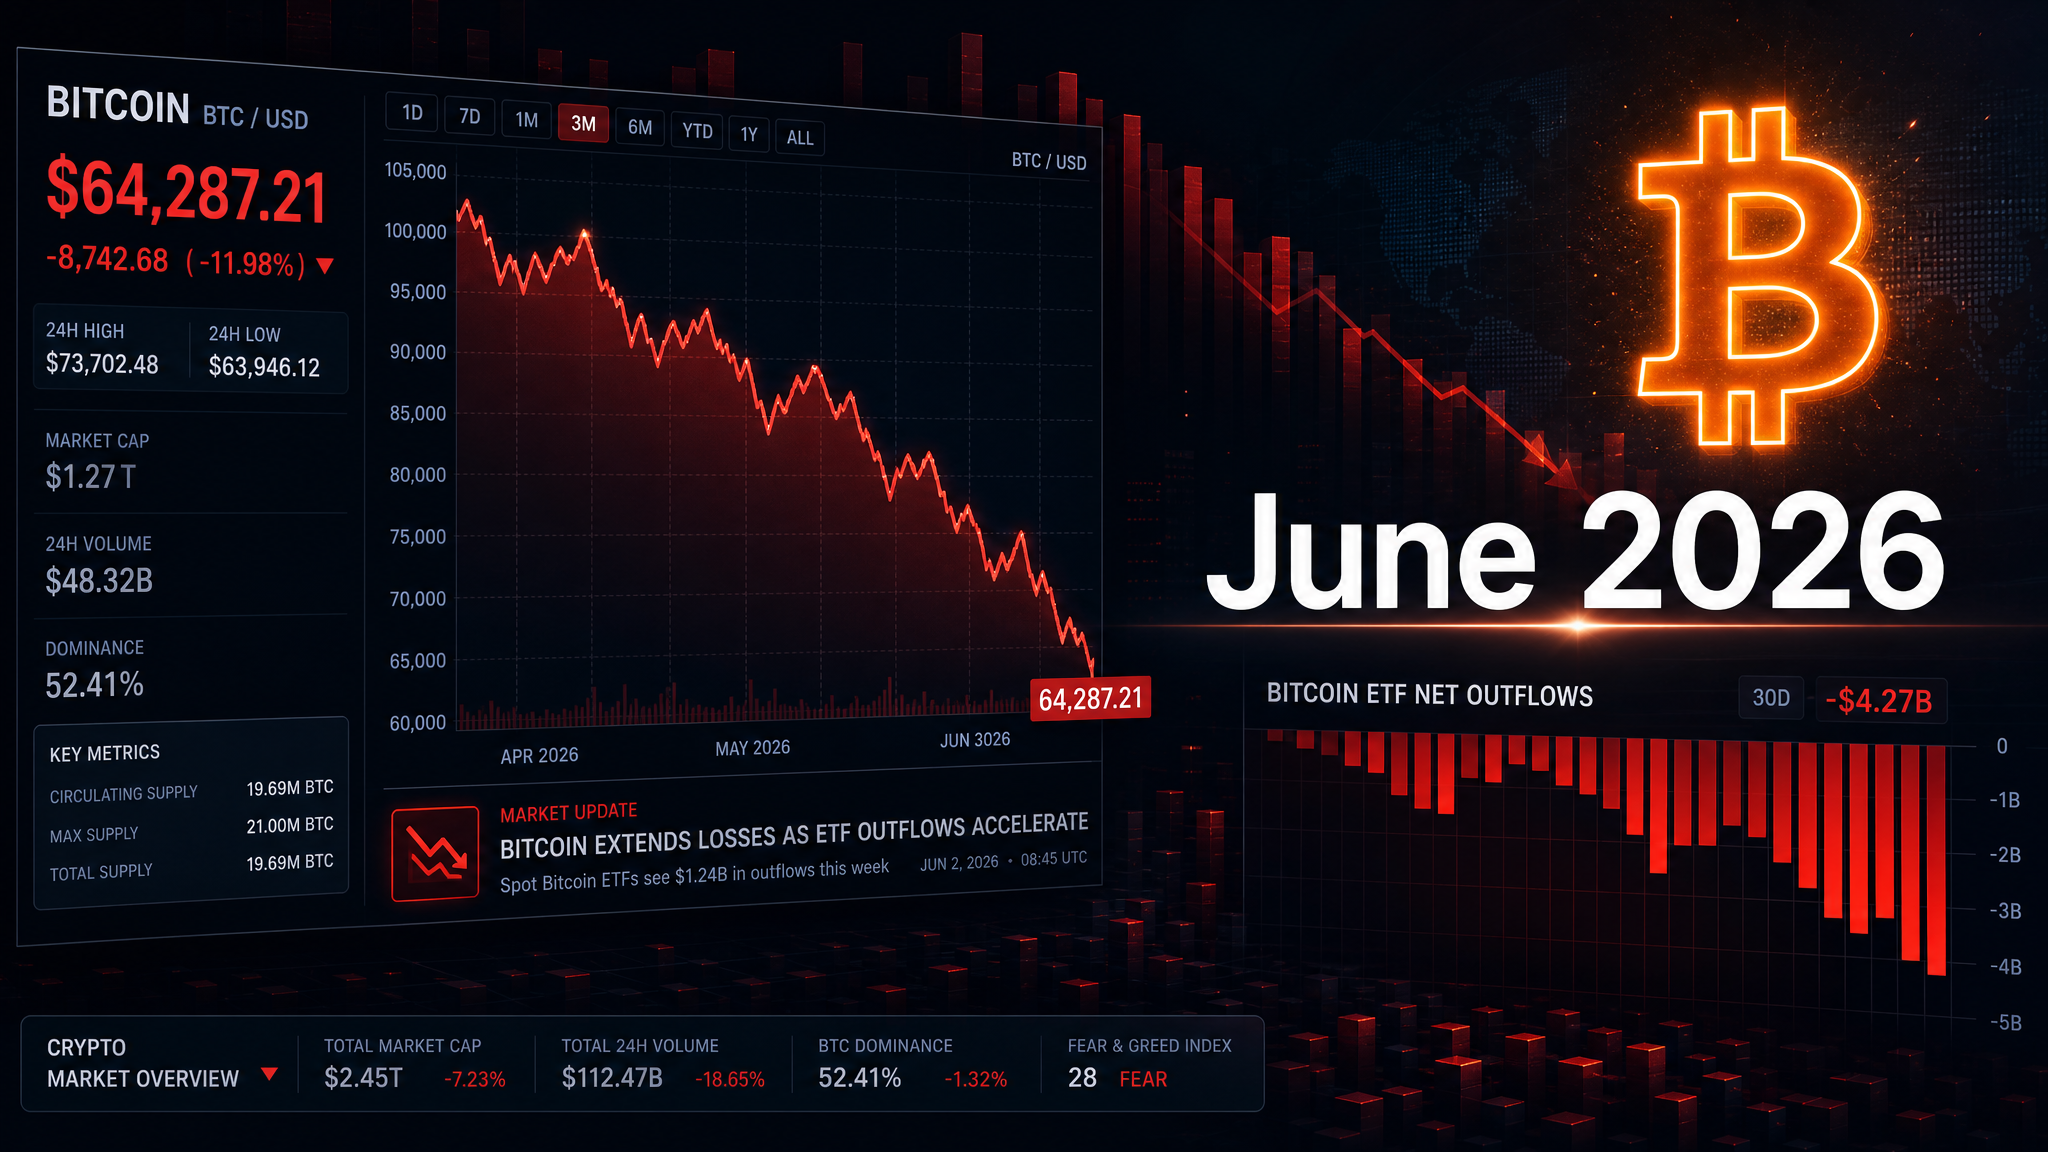
The Bitcoin ETF outflows June 2026 just broke every record in the book. Over 13 consecutive trading days ending June 5, institutional investors yanked roughly $4.4 billion from U.S. spot Bitcoin ETFs — the largest sustained withdrawal since these products launched in January 2024. Bitcoin dropped below $61,000. Ethereum cratered near $1,600. And the Fear & Greed Index hit a gut-wrenching 13. So what actually happened, and more importantly, what does it mean for your portfolio?
Let's cut through the noise.
Disclosure: This article contains affiliate links. We may earn a commission at no extra cost to you if you make a purchase through these links. See our affiliate disclosure for details.
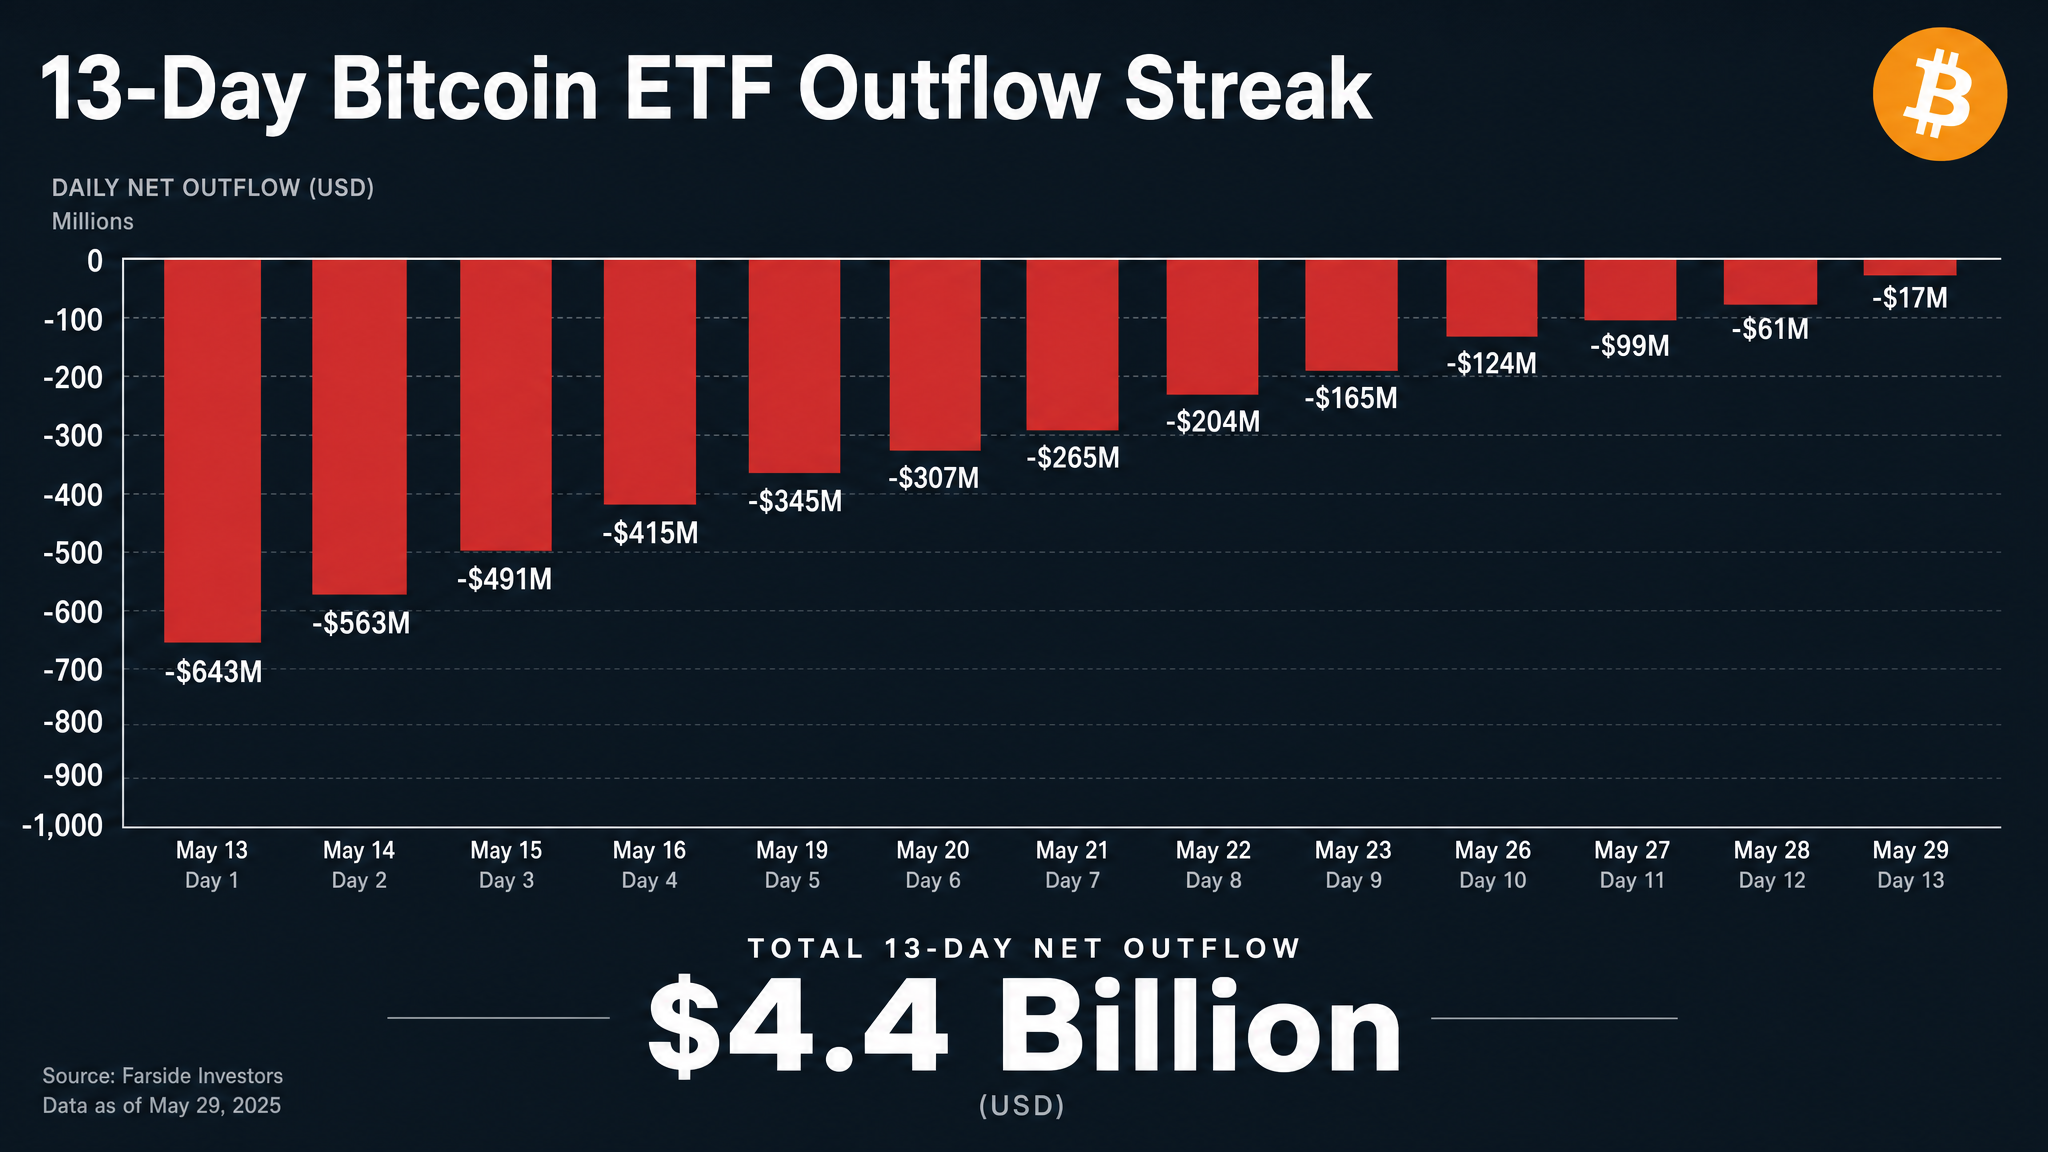
What Actually Happened: 13 Days of Record Outflows
Picture this: every single trading day for nearly three weeks, more money left Bitcoin ETFs than entered them. That's not a blip — that's a trend.
The streak ran from late May through June 5, 2026. At its worst, a single session saw $1.1 billion walk out the door. By the time it ended, cumulative net outflows had erased the year-to-date inflow gains and pushed the overall flow picture into negative territory for the first time since launch.
Bitcoin, which had been trading comfortably between $68,000 and $75,000 through most of May, broke through $65,000 support, then $60,000 — a level it hadn't touched since late 2024. As of June 10, BTC opened at $61,672 and was already sliding toward $60,937 by mid-morning. Ethereum fared worse on a percentage basis, dropping from above $2,000 to around $1,615.
The derivatives market piled on. Roughly $1.5 to $1.8 billion in leveraged long positions were liquidated in single 24-hour windows as prices moved against traders. That kind of forced selling creates a feedback loop — prices drop, liquidations trigger, prices drop more.
The Three Forces Behind the Institutional Exit
This wasn't random panic. Three distinct forces converged to push institutional money out of Bitcoin ETFs simultaneously.
Macro Headwinds and Rising Treasury Yields
The Federal Reserve's rate-cut narrative — which had been a tailwind for risk assets throughout early 2026 — started unraveling. Rising 10-year U.S. Treasury yields made the opportunity cost of holding non-yielding Bitcoin look increasingly unattractive to institutional allocators managing large portfolios.
Add in the US-Iran geopolitical tensions that flared in late May and early June. Rising oil prices fed inflation concerns, which in turn pushed back expectations for any Fed pivot. When the macro environment turns hostile, institutional money doesn't wait around — it rotates fast.
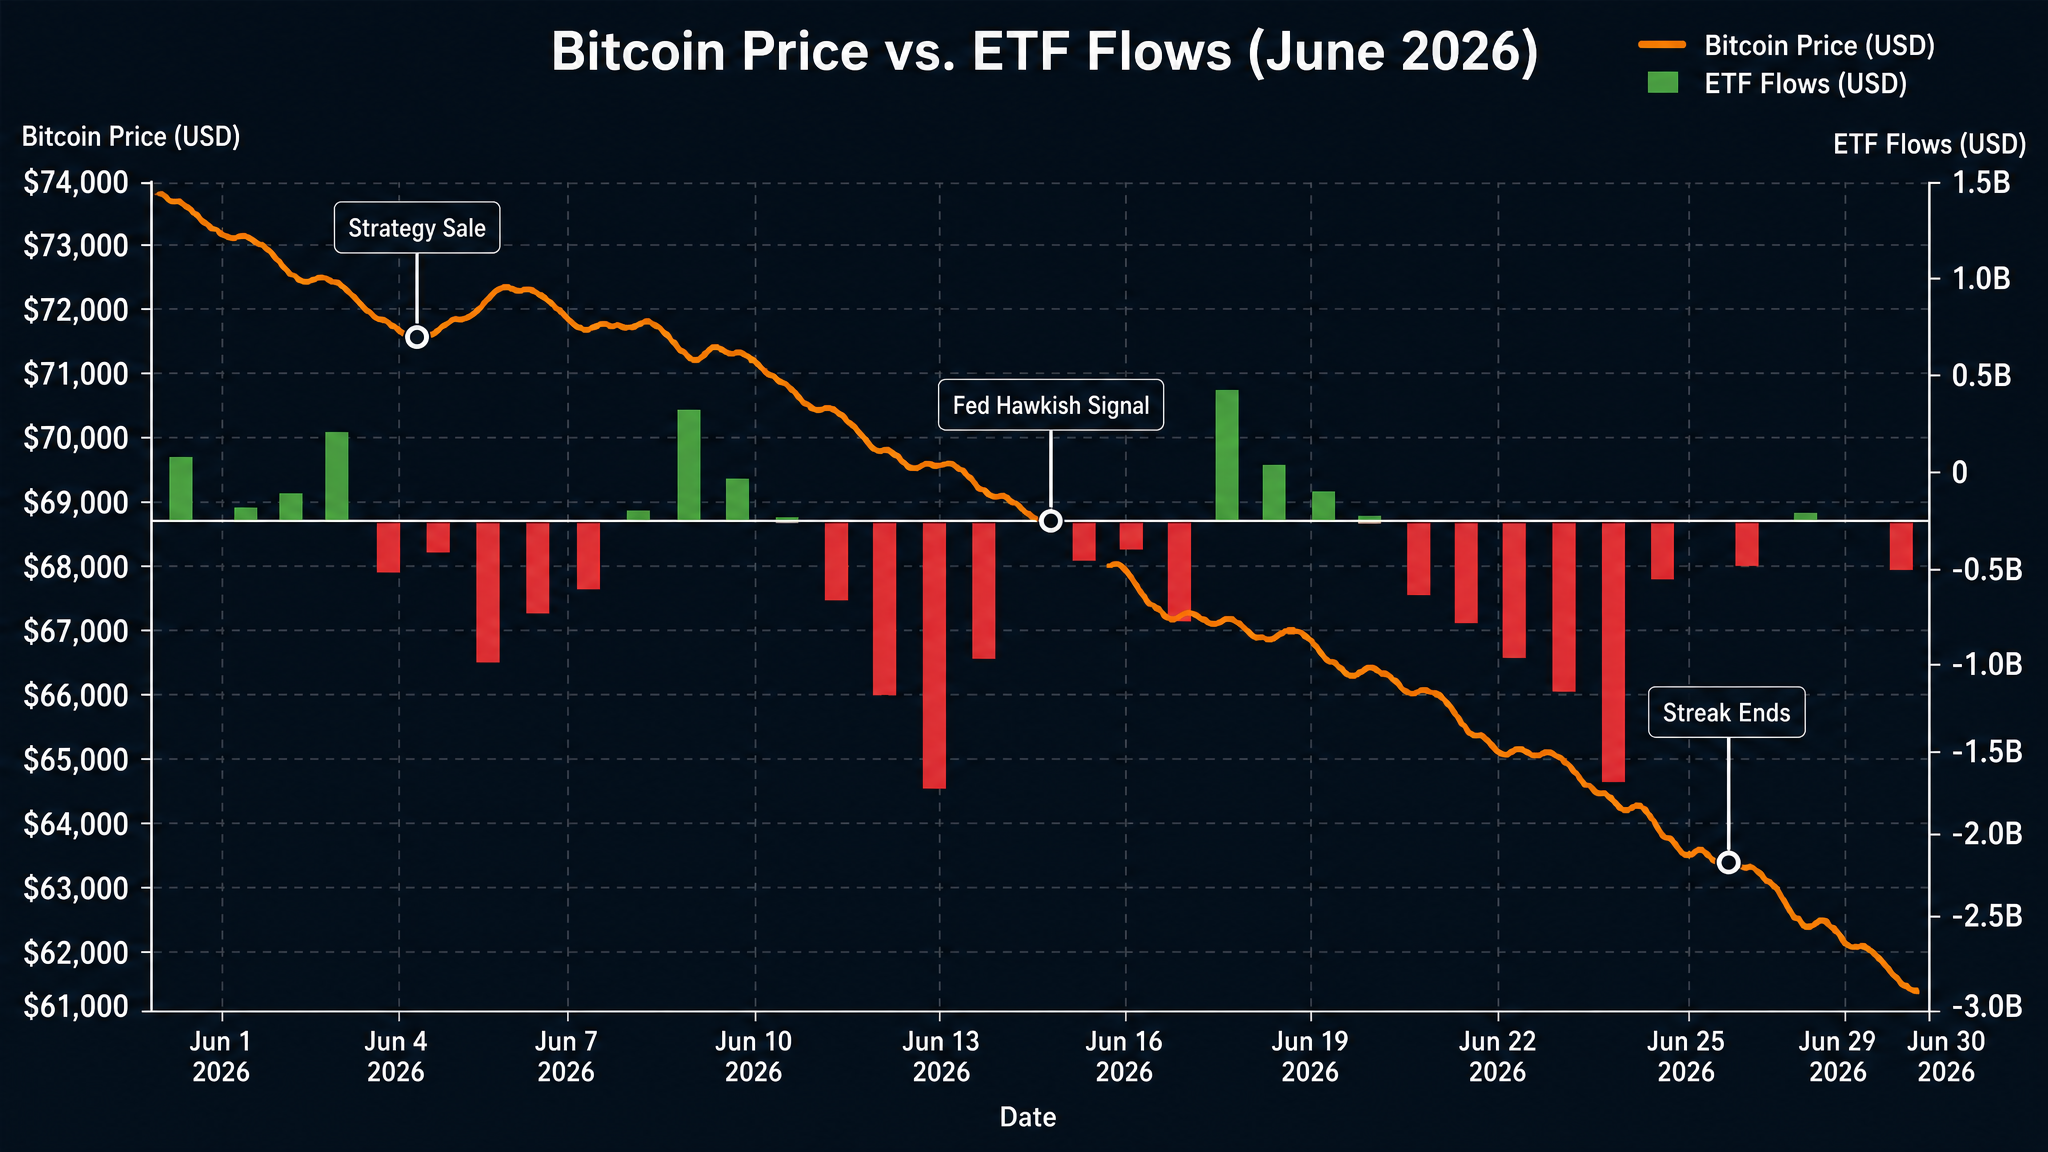
Strategy's Bitcoin Sale — Small Volume, Big Signal
Here's the one that really rattled sentiment: Strategy (formerly MicroStrategy) disclosed it had sold 32 BTC. Thirty-two. Against a holding of hundreds of thousands of coins, that's statistically irrelevant.
But it was the first sale since 2022. Michael Saylor built his entire brand on "never sell." When that narrative cracked — even slightly — it sent a psychological shockwave through the market. Retail and institutional investors alike started asking: if Saylor is selling, what do they know that we don't?
The answer was probably "nothing dramatic." But perception drives markets in the short term, and this perception was bearish.
Capital Rotation Into AI and Semiconductors
The third force was arguably the most structural. Institutional capital didn't just leave crypto — it went somewhere specific. AI infrastructure stocks, semiconductor companies, and the broader tech rally (including the SpaceX IPO buzz) were pulling capital away from Bitcoin's "digital gold" narrative.
When Bitcoin can't hold its inflation-hedge story during a period of actual inflation concerns, that's a problem. Institutions that had allocated to BTC as a macro hedge found better momentum trades elsewhere and acted accordingly.
Which ETFs Got Hit Hardest (and Why)
Not all Bitcoin ETFs suffered equally. Grayscale's GBTC took disproportionate outflows — and the reason is straightforward: fees. GBTC charges a 1.50% annual expense ratio. Compare that to BlackRock's IBIT at around 0.25% or Fidelity's FBTC at 0.25%, and you can see why cost-conscious institutional investors used the volatility as an opportunity to rebalance.
This wasn't panic selling across the board. It was, in many cases, rational portfolio management — moving from expensive wrappers to cheaper ones, or rotating out of crypto entirely while locking in gains from positions established in the $52,000–$58,000 range during Q1 2026.
FBTC and ARKB continued to see pressure even after the 13-day streak technically ended on June 5 with a modest $3.05 million net inflow. The streak may have broken, but the underlying sentiment hadn't fully recovered.
One number worth keeping in mind: cumulative lifetime net inflows across all spot Bitcoin ETFs still stand at approximately $55 billion. The structural demand thesis isn't dead — it just took a serious bruising.
Where Bitcoin Stands Now: Technical Levels to Watch
As of June 10, Bitcoin is trading in the low $60,000s — a zone that carries significant technical weight. The $60,000 level is both a psychological round number and a structural support that held through most of 2024's bull run.
The RSI has entered oversold territory. The Fear & Greed Index sits at 13 — deep in "extreme fear." Historically, these readings have preceded meaningful bounces, though they can persist longer than most traders expect.
Some small-scale miners are reportedly shutting down operations as prices approach production costs. That's a bearish signal in the short term (more selling pressure from miners), but it also means the market is approaching a natural floor where unprofitable supply gets removed.
Key levels to watch:
- $60,000 — Major psychological and technical support. A clean break below this on high volume would be concerning.
- $57,000–$58,000 — Where many institutional ETF positions were established in Q1 2026. Expect buying interest here.
- $65,000 — First meaningful resistance on any recovery. Reclaiming this level would signal a shift in momentum.
Protect your holdings with proper cold storage during volatile periods. Serious about security? The Ledger Nano X keeps your private keys offline and safe — especially important when exchange risk spikes during market stress.
What This Means for Retail Investors
If you're a retail investor watching institutional money flow out of Bitcoin ETFs, the temptation is to follow. Don't make that mistake automatically.
Institutional investors operate on different timelines and constraints than you do. A pension fund that bought BTC ETFs at $55,000 and is now sitting on a 10% gain has every reason to take profits during volatility. You, with a longer time horizon and no quarterly reporting requirements, might be in a completely different position.
A few practical takeaways:
- Dollar-cost averaging (DCA) works in your favor here. If you believe in Bitcoin's long-term thesis, these prices represent an opportunity to accumulate at levels not seen since late 2024.
- Watch ETF flow data, not just price. When the 13-day outflow streak ended, that was a signal worth noting. Sustained inflows returning would confirm institutional re-entry.
- Don't ignore the macro. Fed meeting dates and Treasury yield movements are now directly correlated with Bitcoin price action. Add them to your calendar.
- Manage leverage carefully. The $1.5–1.8B in liquidations during this period were almost entirely leveraged longs. If you're using leverage, this is a reminder of how fast things can move.
Want to sharpen your trading skills before the next volatile cycle? For a structured approach to learning crypto trading, Icoinpro offers step-by-step training that has helped thousands of beginners navigate exactly these kinds of market conditions.
The Bottom Line: Cyclical Correction or Structural Shift?
The honest answer is: probably cyclical, but with structural questions worth monitoring.
The $55 billion in cumulative ETF inflows doesn't evaporate because of a 13-day outflow streak. Institutional infrastructure — custody solutions, regulatory frameworks, ETF products — is more developed than it's ever been. The Clarity Act is moving through the Senate. The DTCC just announced a Stellar blockchain integration for tokenized securities. These are long-term bullish signals.
But the short-term picture is messier. Bitcoin's narrative as a macro hedge took a hit when it failed to hold up during an inflationary period. That's a story worth watching. If Bitcoin can't serve as "digital gold" when gold is rallying, the investment thesis for institutional allocators gets harder to defend.
The next 30–60 days will be telling. Watch ETF flow data weekly. Watch the Fed. Watch whether Bitcoin can reclaim $65,000 on meaningful volume. Those three data points will tell you more than any price prediction.
For a deep dive into Bitcoin's monetary philosophy and why long-term holders stay convicted through corrections like this, grab a copy of The Bitcoin Standard — it's essential reading for understanding why institutional adoption, despite the noise, continues to grow.
Key Takeaways
- Bitcoin ETFs saw $4.4B in net outflows over 13 consecutive days in June 2026 — a record since launch.
- Three drivers: rising Treasury yields, Strategy's symbolic BTC sale, and capital rotation into AI/tech.
- GBTC was hit hardest due to its higher 1.50% fee vs. competitors at 0.20–0.25%.
- Cumulative lifetime inflows remain ~$55B — structural demand is intact despite the correction.
- Key support: $60,000. Key resistance on recovery: $65,000. Watch Fed meetings and ETF flow data.
- For retail investors: DCA opportunities exist, but manage leverage carefully and monitor macro signals.
Understanding the market is step one. Profiting from it is step two.
Reading analysis is valuable, but knowing how to generate your own — and act on it with discipline — is where real results come from. That skill is trainable.
The program I recommend to people who ask me is this crypto trading course — it\'s the one I point friends and family to when they\'re serious about learning. Daily lessons, live analysis, and a community that actually helps.
Affiliate link — I may earn a commission at no extra cost to you. I only recommend what I genuinely use.
Disclaimer: The information provided on this website is for educational and informational purposes only. It should not be considered financial or investment advice. Cryptocurrency investments carry significant risk. Always do your own research and consult with a qualified financial advisor before making investment decisions.
Free Crypto Insights
Get weekly trading tips, market analysis, and exclusive strategies delivered to your inbox.