On-Chain Analytics: The Advanced Crypto Trading Edge You're Missing in 2026
Affiliate Disclosure: This article may contain affiliate links. We may earn a commission at no extra cost to you. All opinions are our own.
Marcus Chen
Senior Crypto Analyst & Educator
Certified Blockchain Professional | Former Wall Street Analyst
Marcus Chen is a cryptocurrency analyst and educator with over 8 years of experience in digital asset trading. He has helped thousands of beginners navigate the crypto markets through practical, actionable education.

On-Chain Analytics: The Advanced Crypto Trading Edge You're Missing in 2026
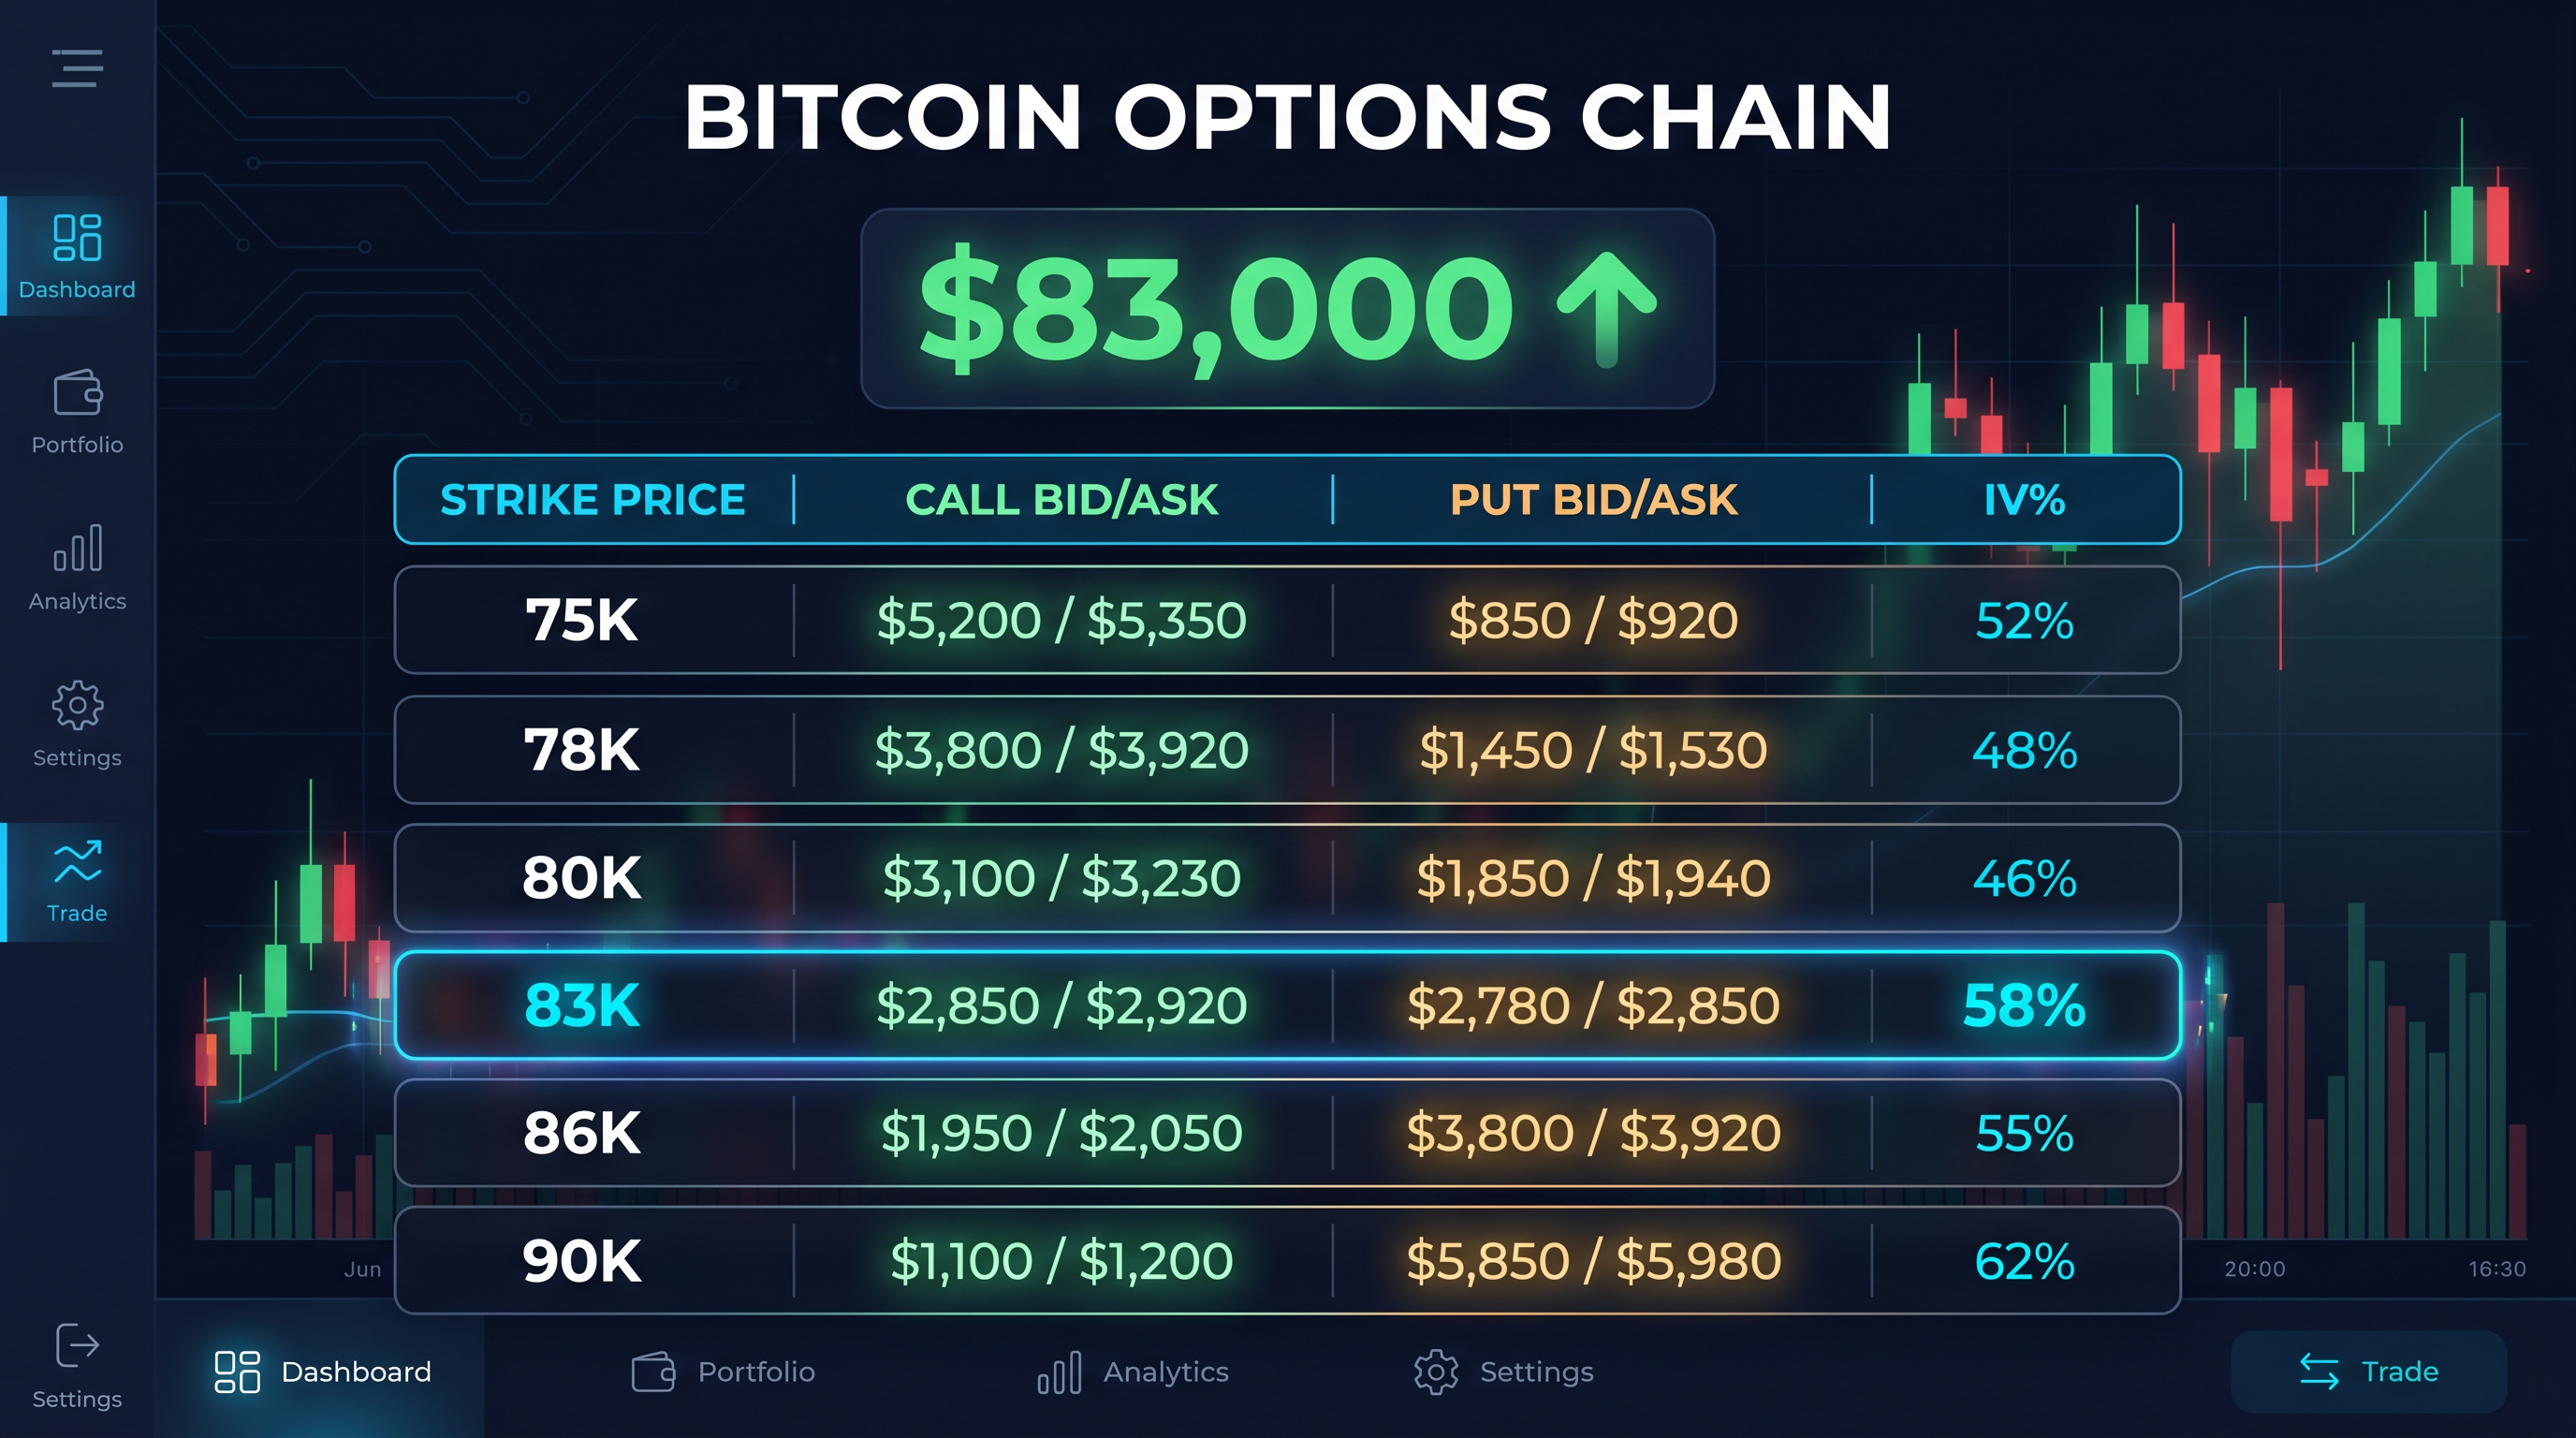
Most traders stare at candlestick charts and call it research. But the traders consistently beating the market in 2026 are reading something else entirely — on-chain analytics crypto trading data that reveals what's actually happening beneath the price action. We're talking about wallet flows, realized profits, exchange reserves, and institutional ETF movements. This is the layer where real edges live.
If you've been trading crypto for a while and feel like you're always one step behind the "smart money," this guide is for you. We'll break down the five metrics that matter most, how to build a systematic framework around them, and which tools give you the clearest signal-to-noise ratio in today's market.
What On-Chain Analytics Actually Tells You (That Price Charts Don't)
Price is a lagging indicator. By the time a breakout shows up on your chart, the move is often already priced in by those who saw the on-chain signals first. On-chain data is different — it's the raw, unfiltered record of every transaction on a public blockchain. No manipulation, no spin. Just wallets moving coins.
Think of it this way: when a whale moves 10,000 BTC from cold storage to an exchange, that's a potential sell signal. When long-term holders are quietly accumulating while retail panics, that shows up in the data too. Price charts won't tell you that. On-chain metrics will.
In 2026, this data layer has become even more critical. The approval of spot Bitcoin ETFs in early 2024 added a new dimension — institutional flows that don't always show up in traditional on-chain wallet data. BlackRock's IBIT alone captured 71% of positive ETF inflows, and total BTC ETF assets under management hit $134 billion by January 2026. Serious traders now track both on-chain wallet activity and ETF flow data together.
The 5 On-Chain Metrics Every Serious Trader Tracks
1. NUPL — Net Unrealized Profit/Loss
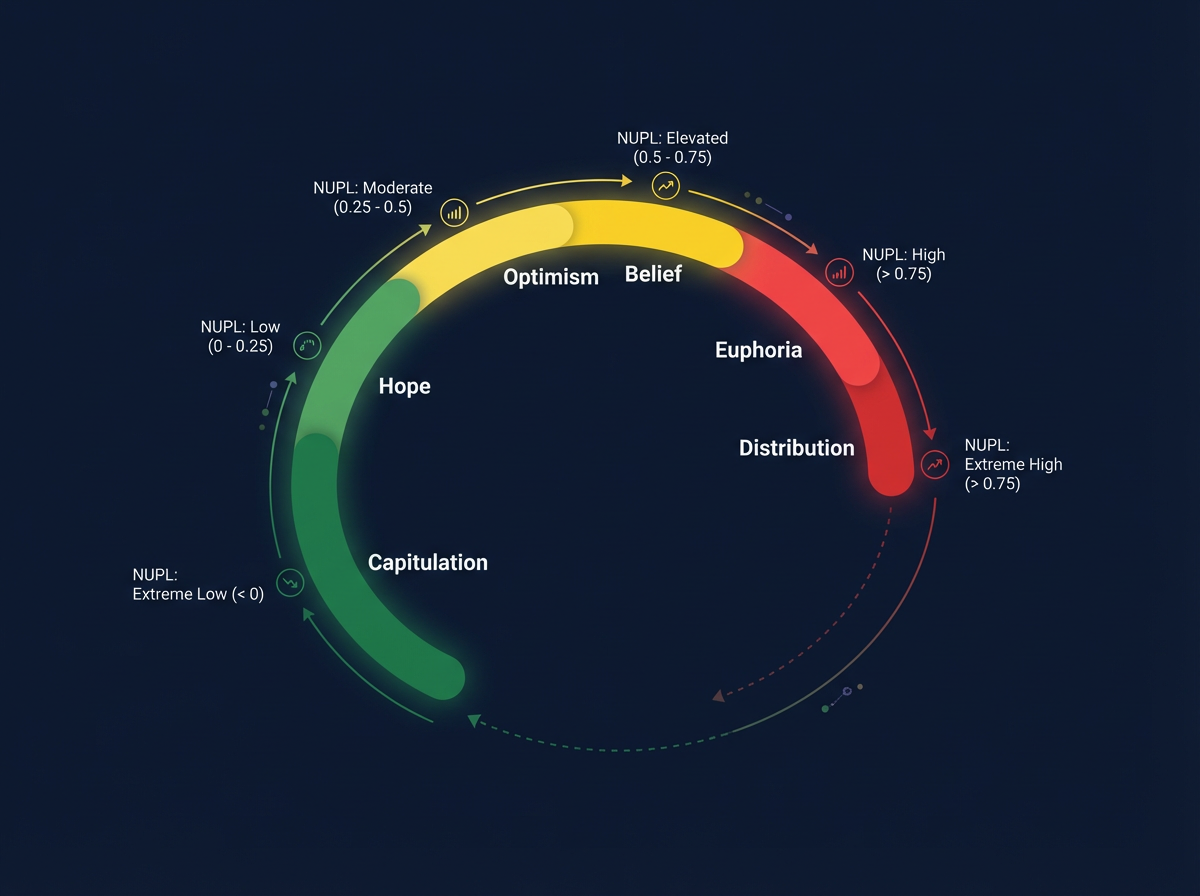
NUPL measures the total paper gains or losses held by all Bitcoin investors, normalized against market cap. It's one of the cleanest cycle indicators available. Here's how to read it:
- Above 0.75 (Euphoria): Historically marks cycle tops. Time to reduce exposure.
- 0.5–0.75 (Belief): Healthy bull market. Momentum is building.
- 0.25–0.5 (Optimism): Recovery phase. Consider accumulating.
- 0–0.25 (Hope): Early recovery or late bear. Dollar-cost average here.
- Below 0 (Capitulation): Generational buying opportunities. Rare, but powerful.
As of early 2026, NUPL sat around 0.29 — squarely in the "Optimism" zone. That's not a screaming buy signal, but it's far from overheated. Contrast that with late 2021 when NUPL pushed above 0.7 before the crash. The metric doesn't predict exact timing, but it tells you where you are in the cycle.
2. MVRV Z-Score: Finding Bitcoin's Fair Value
The MVRV Z-Score compares Bitcoin's market value to its realized value (the average price at which all coins last moved), then normalizes that against historical standard deviations. It answers a simple question: is Bitcoin cheap or expensive right now?
- Z-Score above 7: Extreme overvaluation. Every major cycle top has hit this zone.
- Z-Score below 0: Extreme undervaluation. Historically, the best buying windows.
In January 2026, the Z-Score was around 1.32 — fair value territory with room to run. By April 2026, some data sources showed it dipping toward -2.37, suggesting deep undervaluation relative to the trailing 12-month range. That kind of reading, combined with other bullish signals, is exactly the setup long-term traders look for.
3. Exchange Flows: Reading the Supply Pressure
When coins move onto exchanges, it usually means someone is preparing to sell. When coins move off exchanges into cold storage, it signals accumulation. Simple concept, powerful signal.
Large exchange inflows — say, 50,000+ BTC moving to Binance or Coinbase in a short window — often precede selling pressure. Conversely, sustained outflows over weeks tend to tighten supply and support price appreciation. In 2026, you need to factor in that some institutional accumulation now happens through ETF custodians rather than on-chain wallets, so exchange flow data alone doesn't tell the full story anymore.
4. SOPR — Are Holders Selling at a Profit?
SOPR (Spent Output Profit Ratio) measures whether coins being moved on-chain are being sold at a gain or a loss. A reading above 1 means sellers are in profit. Below 1 means they're selling at a loss — often a capitulation signal.
In a healthy bull market, SOPR consistently stays above 1 as holders take profits into strength. When SOPR drops below 1 and stays there, it typically means the market is in distress. Watch for SOPR bouncing back above 1 after a dip — that's often a confirmation that the worst of a correction is over.
5. ETF Flows: The New Institutional Signal
This one didn't exist two years ago. Now it's essential. Daily ETF flow data from products like BlackRock's IBIT and Fidelity's FBTC gives you a direct read on institutional demand. Sustained inflows over multiple weeks signal institutional accumulation. Persistent outflows suggest risk-off sentiment among the largest players in the market.
Combine ETF flow data with on-chain exchange outflows and you get a much clearer picture of whether the big money is buying or selling. When both signals align — ETF inflows rising while exchange reserves fall — that's a high-conviction setup.
Building a 3-Step On-Chain Trading Framework
Raw data is useless without a framework. Here's a systematic approach that professional traders use to turn on-chain metrics into actual trade decisions:
Step 1 — Establish the Macro Regime. Before looking at any individual metric, determine where you are in the cycle. Check NUPL first. Then validate with MVRV Z-Score. Finally, assess supply dynamics through exchange reserves and ETF flows. This gives you the macro context — are we in accumulation, distribution, or somewhere in between?
Step 2 — Identify Entry and Exit Signals. Once you know the regime, look for specific triggers. Entry signals: NUPL in the hope or capitulation zone, MVRV Z-Score below 1, sustained exchange outflows, increasing long-term holder supply, and accelerating ETF inflows. Exit signals: NUPL approaching euphoria (0.7+), MVRV Z-Score above 6, sharp spikes in exchange inflows, declining long-term holder supply, and persistent ETF outflows.
Step 3 — Combine with Technical Analysis. On-chain data tells you the "what" — what the market participants are doing. Technical analysis tells you the "when" — where price is likely to react. The highest-probability trades happen when both align. A NUPL in the optimism zone combined with a clean technical breakout above a key resistance level? That's a setup worth sizing into.
Want to accelerate your trading journey? Explore Icoinpro's daily trading signals and education platform — they combine technical and on-chain analysis in a structured curriculum designed for serious traders.
The Best On-Chain Analytics Tools in 2026
You don't need to pay for all of them. Pick two or three that match your trading style and go deep.
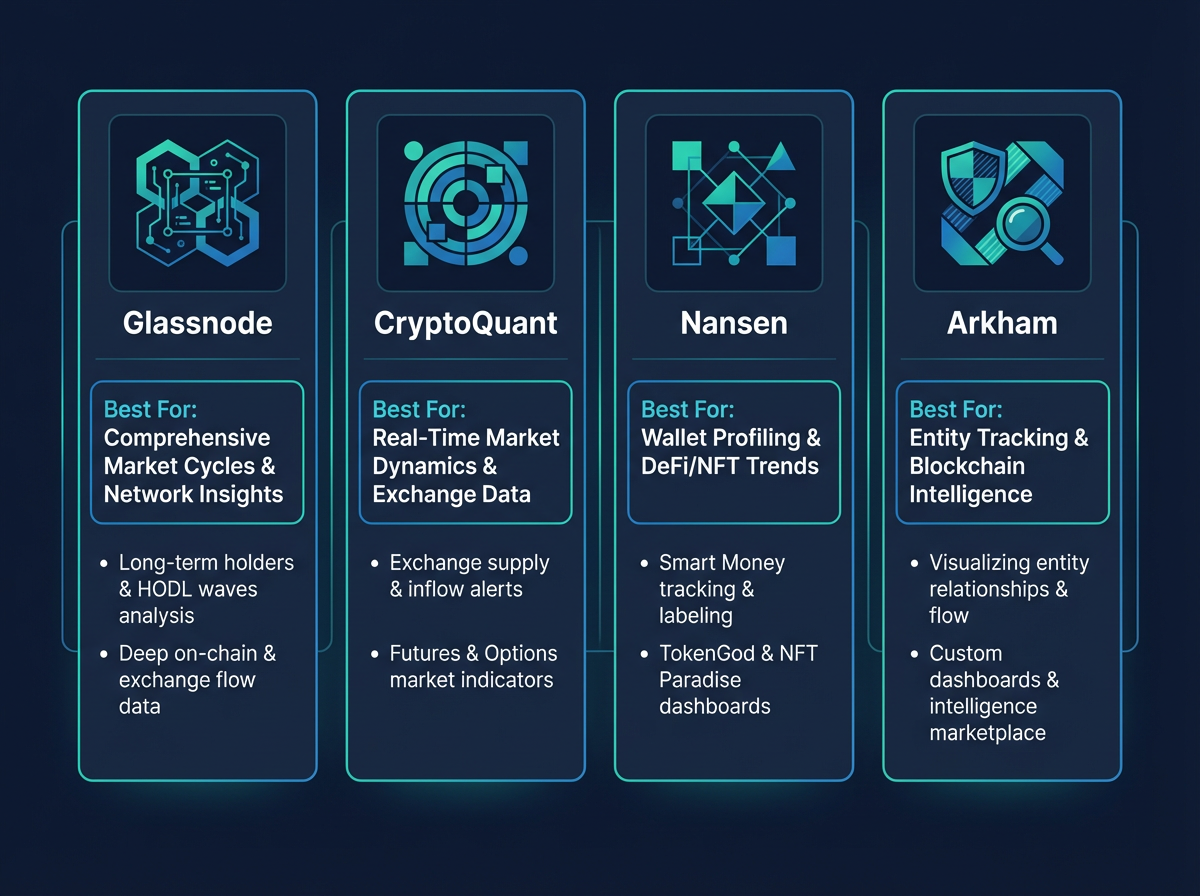
- Glassnode: The gold standard for BTC and ETH metrics. Best for NUPL, MVRV, and long-term holder data. Their weekly reports alone are worth the subscription.
- CryptoQuant: Specializes in exchange flows, miner data, and stablecoin metrics. Ideal for short-to-medium-term traders who need real-time supply signals.
- Nansen: Tracks over 500 million labeled wallets across 20+ chains. If you want to follow "smart money" — hedge funds, early investors, protocol treasuries — Nansen is your tool.
- Arkham: AI-powered entity identification. Links wallet addresses to real organizations and individuals. Excellent for tracking institutional movements and whale alerts.
- DeFiLlama: Free and comprehensive for DeFi TVL, protocol fees, and cross-chain liquidity data. Essential if you're trading DeFi tokens.
- CoinGlass: Derivatives-focused. Open interest, funding rates, and liquidation heatmaps. Critical for futures traders who want to understand leverage positioning.
Combining On-Chain Data with AI Signals
Here's where things get interesting. In 2026, AI-powered on-chain analytics tools are generating trading signals that would take a human analyst hours to compute manually. These systems process multi-chain datasets, detect non-linear patterns, and deliver time-sensitive alerts — often with optimal holding periods of 3 to 7 days for on-chain-driven trades.
Practical applications include: arbitrage alerts when exchange spreads widen, smart contract monitoring for liquidation cascades, altcoin discovery based on wallet accumulation patterns, and rug pull risk detection through behavioral indicators. Some platforms use zero-knowledge proofs to verify off-chain computations, adding an extra layer of trust.
The key is not to outsource your judgment entirely to AI. Use these signals as one input among several. When an AI-generated on-chain alert aligns with your own NUPL/MVRV analysis and a clean technical setup, that's when you act with conviction.
Protect your crypto assets with a Ledger hardware wallet — the gold standard in cold storage security. As your portfolio grows with better trading decisions, keeping your assets safe becomes non-negotiable.
Risk Management When Trading on On-Chain Data
On-chain signals are powerful, but they're not infallible. A few hard rules:
- Never trade on a single metric. NUPL alone won't save you. MVRV alone won't either. The edge comes from confluence — multiple signals pointing the same direction.
- On-chain data has lag. Some metrics update daily, not in real-time. Don't use them for scalping or intraday trades. They're best for swing trades and position sizing decisions.
- Macro overrides everything. In April 2025, even deeply undervalued on-chain readings couldn't prevent a sharp correction when macro risk-off sentiment hit. Always know the macro environment.
- Size positions based on conviction, not certainty. Even the best on-chain setups fail. Use position sizing to ensure no single trade can blow up your account.
- Keep records. Track which signals you acted on and why. Over time, you'll learn which metrics work best for your trading style and timeframe.
For a structured approach to learning crypto trading, Icoinpro offers step-by-step training that has helped thousands of beginners and intermediate traders build systematic, data-driven approaches to the market.
Key Takeaways
- On-chain analytics crypto trading gives you visibility into market participant behavior that price charts simply can't provide.
- NUPL and MVRV Z-Score are your macro cycle indicators — use them to determine where you are in the market cycle before making any major position decisions.
- Exchange flows and SOPR provide shorter-term supply/demand signals. ETF flows are now equally important for reading institutional sentiment.
- Build a 3-step framework: establish macro regime → identify entry/exit signals → confirm with technical analysis.
- Glassnode, CryptoQuant, Nansen, and Arkham are the top tools in 2026. You don't need all of them — pick two that match your style.
- AI-powered on-chain signals are increasingly useful, but treat them as one input, not the whole strategy.
- Risk management is non-negotiable. No signal is perfect. Confluence and position sizing are your best defenses.
Disclaimer: This content is for informational purposes only and should not be considered financial advice. Cryptocurrency investments carry significant risk. Always do your own research (DYOR) before making any investment decisions.
This article contains affiliate links. We may earn a commission at no extra cost to you if you make a purchase through these links. See our affiliate disclosure for details.
Updated: On-Chain Analytics Tools in May 2026
The on-chain analytics landscape has evolved significantly. Here are the key developments as of May 2026:
- Glassnode AI Alerts: Glassnode now uses AI-powered alerts to flag unusual activity — sudden exchange deposit surges, dormant whale movements — in real time. Multi-chain coverage expanded to Base, zkSync, and Solana.
- Nansen Agentic Trading: Nansen launched an "agentic onchain app" that combines research, analysis, and trade execution in one interface. Ask a question in natural language, get wallet-level intelligence, execute directly.
- Nansen GPT Search: Query specific wallet activities using natural language — "show me wallets that bought ETH before the last 20% rally" — without writing SQL or custom queries.
- Expanded L2 Coverage: Both Glassnode and Nansen now cover Base, zkSync, Linea, Scroll, and Solana, reflecting where on-chain activity has migrated in 2026.
The trend is clear: on-chain analytics is moving from data dashboards to actionable intelligence. The gap between seeing data and acting on it is closing fast.
Frequently Asked Questions
What is the best on-chain analytics tool in 2026?
Glassnode is best for macro Bitcoin/Ethereum analysis and market cycle timing. Nansen excels at wallet-level "smart money" tracking and DeFi flows. Use both together for a complete picture — they're complementary, not competing.
Is Glassnode worth the subscription cost?
For serious traders and investors, yes. The Advanced plan (~$39/month) unlocks the full metrics library including MVRV, SOPR, and exchange flow data that institutional desks use. The free tier covers basic metrics but lacks the depth needed for active trading decisions.
What is "smart money" in crypto on-chain analytics?
Smart money refers to wallets with a track record of profitable, early, or strategically significant behavior — hedge funds, early-stage investors, high-performing traders. Nansen labels 500M+ addresses, letting you see when these wallets are accumulating or distributing before price moves.
Can on-chain analytics predict crypto prices?
Not directly, but they provide leading indicators. Metrics like exchange outflows (bullish — coins leaving exchanges), MVRV ratio (market overvaluation signal), and whale accumulation patterns have historically preceded major price moves. They're tools for probabilistic analysis, not crystal balls.
What free on-chain analytics tools are available?
Glassnode's free tier covers basic metrics. Dune Analytics offers free custom dashboards with SQL queries. CryptoQuant has a free tier for exchange flow data. For most beginners, these free options provide sufficient insight before committing to paid subscriptions.
Related Articles
Ready to put these strategies into practice?
The trading concepts in this article work — but only if you have the right foundation. I learned most of what I know through structured training that connected the dots between theory and live markets.
The program I recommend to people who ask me is this crypto trading course — it\'s the one I point friends and family to when they\'re serious about learning. Daily lessons, live analysis, and a community that actually helps.
Affiliate link — I may earn a commission at no extra cost to you. I only recommend what I genuinely use.
Disclaimer: The information provided on this website is for educational and informational purposes only. It should not be considered financial or investment advice. Cryptocurrency investments carry significant risk. Always do your own research and consult with a qualified financial advisor before making investment decisions.
Free Crypto Insights
Get weekly trading tips, market analysis, and exclusive strategies delivered to your inbox.